Greater visibility into your project data than you've ever had before.
Imagine scrolling and zooming painlessly with fluid intuitive motions —
using our amazing Scroomer™. From the big picture to the finest detail, all project stakeholders can truly view all you do.
Manage Change
It's inevitable that, as a project is executed, changes will need to be made when circumstances change.
One of the keys to successful execution of your project is effective management of these changes. Vuedoo's unique design makes it easy
to do this — to update, track and visualise your project's status, and to clearly see the consequences of any changes you make.
Tasks, resources or dependencies may be added or deleted; task's start or duration may change; and tasks may need to be reassigned.
Vuedoo's innovative visualisation and fluid drag-and-drop interface helps you stay on top of all this and gives you the thing you want most:
control of your project.
|
 |
Track Progress
As is usual, a project's progress is measured by its percent complete. The percent complete of a detail task is set
based on feedback from the person assigned to it. Then, the percent complete of summary tasks, phases and the entire project are automatically
determined using the industry-standard definition: at any node in the task hierarchy, percent complete is calculated
as the ratio of the total completed and total scheduled durations of all detail tasks below that node. However, the visualisation of
percent complete is done differently in Vuedoo: Most other project management software highlights task completion with another bar drawn
on top, a darker fill colour etc, which makes completed tasks stand out more than ones that haven't started. This is back to front —
what's done is done, and what matters more is what's coming up. So Vuedoo de-emphasises completed tasks to draw your eye to
what's left to be done.

|
Track On-Time Status
Like other project management software, Vuedoo marks the current date with a highlighted vertical line for "TODAY".
Unlike other project management software, Vuedoo has an innovation that highlights which tasks are behind or ahead of schedule,
by marking them in bright red or green respectively. This draws your eye to what needs attention right now. But wait, there's more…!
These red and green dashed lines along the top of the bar not only tell you the that a task is late or early, but by how much.
Obviously, the further behind a task is the more urgent it is that a solution be found. Another important factor in determining the
significance of a late task is whether or not it is on the critical path. The critical path is a sequence of linked tasks
where there is no room for slippage without pushing out the final delivery date. Non-critical tasks
have some room to move without affecting the delivery date; this is known as slack or float,
and is indicated by the link arrows being grey. A sequence of linked tasks from the beginning of the project to the end
in which every arrow is red is a critical path.
|
 |
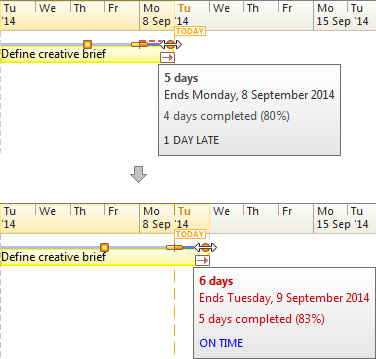 |
Re-Estimate Tasks
If a task is shown as late, this in fact indicates that some of the entered date is wrong — either the task duration
was under-estimated or the percent complete is not up-to-date. After ensuring that the percent complete is correct, if a task
is still shown as late then clearly the estimate is wrong. A simple way to find a better estimate, based on the work done so far,
is to drag out the task duration until the percent complete marker aligns with the TODAY line. Of course this may be too simplistic,
as it assumes an even distribution of work throughout the task duration, and there may be other extenuating circumstances,
such is the task being front-loaded or back-loaded. But it can often be a useful trick in the absence of any other information.
|
Reassign Tasks
One critical factor in creating and maintaining a schedule is to ensure that all tasks are assigned to somebody.
In a Gantt chart you can't normally see this clearly as you have to scan up and down the entire task list,
looking for an empty cell in the assignment column; or you can apply an "unassigned" filter, but you need to remember to do so.
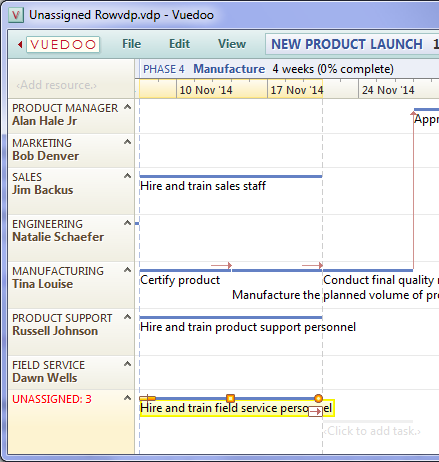
In the Tufte chart, a permanent special resource row at the bottom of the chart groups all unassigned tasks together,
and the unassigned "resource" is highlighted in bright red when the number of unassigned tasks is greater than zero.
(Otherwise it is grey.) You don't have to remember to check a special filter, because the unassigned row is always there and
highlighted when needed. and of course, with the Tufte chart, when assigning the task, it is trivially easy to see who is
free and when, and then assign by simply dragging the task to the appropriate row
|
 |
Edit All Details
Although most of the time it is natural and convenient to directly manipulate the graphical objects in the charts,
sometimes it is easier to enter data textually. Double-clicking on any object opens a Properties Dialog which shows
all details about that object and allows you to edit them. For example, making a large change in the start date of a
task or project is much easier to do by simply typing in the date rather than a long labourious drag operation.
Also, some fields can only be edited in the Properties Dialog, for example Description, Bookmarks and Notes.
All tasks have a Description field, which is a one-line annotation that can be displayed on the taskbar,
to add a more detailed description than the task name, or any other important information.
Bookmarks are hyperlinks to external web pages and documents related to the displayed item.
And all objects have a Notes field, which allows longer multi-line notes to be entered; however these would not fit
in the chart and are instead displayed in the info tip (which can be seen by hovering over any object).

|
Connect with Bookmarks
As can be seen in the Properties Dialog above, each project, phase, task, milestone or resource can be connected to any number of
URLs — webpages, local files and even programs. This feature not only enables quick links to any relevant documents,
but can also be used to provide basic integration with online collaboration tools. Bookmarks can be added, deleted, edited or opened
in the Properties Dialog. The hyperlinks can also be quickly accessed through an item's right-click menu.

|
Choose Text
For each type of object — project, phase, task, milestone or resource — it is possible to choose which details
you want to display in the chart. Simply select Choose Text in the View menu. Of course there is a trade-off here:
showing more data can be helpful, but it reduces the number of tasks you can fit on the screen. Also, the main point of a
graphical visualisation is it makes the textual or numeric data redundant. For example, the start date and duration of each task
can be read off the timeline at the top of the chart. Probably the most useful additional text to show is the assigned resource
in the Timeline Chart or Gantt Chart.

|
View All You Do
Vuedoo's Scroomer, it's project overview and the Tufte Chart's clean, compact display and fully integrated data mean that you can
keep your eye on the big picture at all times. And the subtle yet clearly highlighted progress markers, early/late status and
resource interdependencies mean that you can immediately perceive what needs your attention right now. This enhanced visibility
into your project data means you are better able to understand the wider effects of local changes and makes it much less likely that
you will miss any dropped balls. In particular, being able to easily see the dependencies between people, not just tasks, is critical
to effectively managing a team as they execute the project. Finally, Vuedoo's in-context help, intuitive direct manipulation
and beautiful visualisation mean that you spend less time figuring out how to use the software and more time managing your project.
|
 |
Start using Vuedoo in less than a minute: Download
|
 Follow